Custom Reports
The Custom Report writer offers Clients & Profits users a quick (and relatively easy) way to create simple client lists, job lists, cost reports, and accounting export files. Custom reports are completely customizable (within reasonable limits) and can access any part of the database.
Custom Reports The Custom Report writer offers Clients & Profits users a quick (and relatively easy) way to create simple client lists, job lists, cost reports, and accounting export files. Custom reports are completely customizable (within reasonable limits) and can access any part of the database.
Custom reports are the most flexible part of your Clients & Profits database for one simple reason: They let you see your data exactly how you want to see it. The Custom Report writer offers Clients & Profits users a quick (and relatively easy) way to create simple client lists, job lists, cost reports, and accounting export files. Custom reports are completely customizable (within reasonable limits) and can access any part of the database.
Custom reports select, sort, and display data from your Clients & Profits database. This data can be printed to the window for a quick review, to the printer for a hard copy, or export to disk to be used by spreadsheets or word processors. A custom report is a stand-alone document that contains the report's design, its fields, any queries, and settings that determine how the data is sorted and sub-totaled.
Custom reports don't replace the reports built into Clients & Profits; instead, they supplement them by letting you see data from different fields. They have limitations since they aren't programmable (for example, you can't age accounts automatically before printing a custom client aging report). Custom reports are best suited for showing information that's already available from other built-in reports. The advantage to custom reports is in their flexibility: you can decide which fields to show or hide, as well as how the records are selected. These features give you the ability to see beyond what the standard reports offer.
Customize Reports Toolbox |
|
| There are many tools available to help you customize your reports, including text, line, and drawing tools, as well as a custom color picker. You can also customize the typeface for individual sections of a report using the typeface style and size tools. | |
| Text Tool Use this tool to activate the text cursor, which will allow you to edit text in the reports header, records, and total labels. |
|
| Line Tool Quickly and easily creates individual lines. Click where you want the line to begin, and drag where you want the line to end. |
|
| Rectangle, Rounded-Rectangle, and Ellipse Tools Let's you draw rectangles (including squares) and ellipses (including circles) by dragging from one corner of the rectangle or edge of the ellipse to the opposite corner or edge. |
|
| Typeface, Style, and Size menus Use the Type pull-down menu to apply any font in your system to your report. You can choose the type size in the Size submenu, and apply various styles such as plain, bold, italic, underline, shadow, or outline. |
|
| Color Picker Use the Color Picker to select the type or line color by choosing from the color palete. In addition, you can use the color mixer to fine tune the color to your liking. |
|
HOW IT WORKS
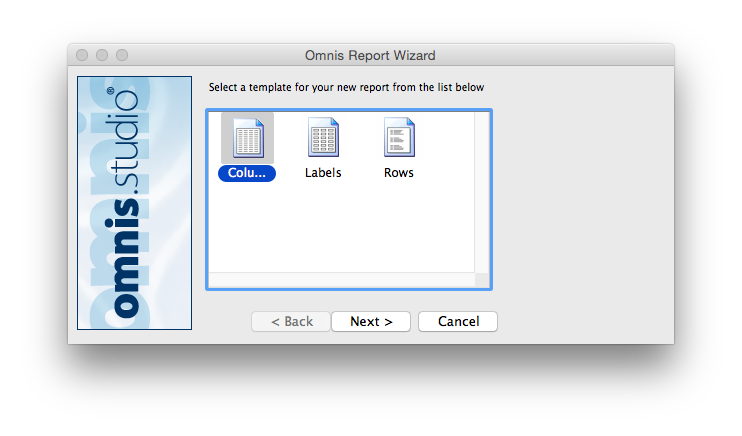
• Custom reports are based on templates that provide the basic design and layout.
• Sections are used to display fields: Page Heading, Sub-total Heading, Record, Sub-total, and Total.
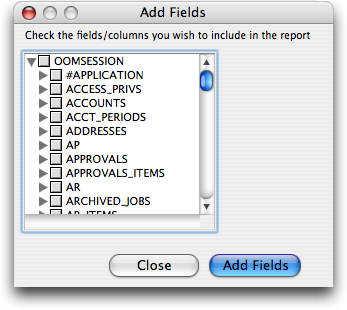
• New fields can be added anytime from the Fields/Queries window.
• Data is selected using queries that define how the database is searched.
• Any field can be sorted, with up to nine fields supported for complex sorting.
• Design tools include text, line, drawing tools, and a custom color picker.
• Reports can be printed to window, printer, or exported to disk.
• Template sections cannot be rearranged, but field positions can be changed.
• The Report Templates file must be stored next to the Clients & Profits application.
• Custom reports are best suited for data already available from built-in reports.
• They supplement, rather than replace, the standard reporting system.
• Export options make them perfect for sharing data with other applications.
The custom report window gives you access to all the tools you need to create professional reports. The main areas include:
— Report Templates
— Fields & Queries
— Sorting Options
— Design Tools
— Export Settings
Custom reports have limitations since they aren't programmable. They can't perform automatic calculations like aging accounts, but they excel at presenting data that's already available in your database in new and useful ways.
See how to :